When working on 3D plots, I’d like to implement a feature where visible edges are drawn as solid lines and obscured (hidden) edges are drawn as dashed lines. I haven’t found a good solution to this problem—until today, when I came across a post enter link description here describing a function called DashedGraphics3D[]. The post explains it in great detail and the results look quite effective. However, I’ve noticed an issue: for the cylinder shown in the example, its generatrices (the straight lines running along the surface) should appear as dashed lines when hidden and solid lines when visible—but this function doesn’t seem to handle that correctly.
Clear[DashedGraphics3D]
DashedGraphics3D::optx =
"Invalid options for Graphics3D are omitted: `1`.";
Off[OptionValue::nodef];
Options[DashedGraphics3D] = {ViewAngle -> 0.4,
ViewPoint -> {3, -1, 0.5}, ViewVertical -> {0, 0, 1},
ImageSize -> 800};
DashedGraphics3D[basegraph_, effectFunction_ : Identity,
opts : OptionsPattern[]] /; !
MatchQ[Flatten[{effectFunction}], {(Rule | RuleDelayed)[__] ..}] :=
Module[{basegraphClean = basegraph /. (Lighting -> _) :> Sequence[],
exceptopts, fullopts, frontlayer, dashedlayer, borderlayer,
face3DPrimitives = {Cuboid, Cone, Cylinder, Sphere, Tube,
BSplineSurface}},
exceptopts = FilterRules[{opts}, Except[Options[Graphics3D]]];
If[exceptopts =!= {}, Message[DashedGraphics3D::optx, exceptopts]];
fullopts =
Join[FilterRules[Options[DashedGraphics3D], Except[#]], #] &@
FilterRules[{opts}, Options[Graphics3D]];
frontlayer =
Show[basegraphClean /. Line[pts__] :> {Thick, Line[pts]} /.
h_[pts___] /; MemberQ[face3DPrimitives, h] :> {EdgeForm[{Thick}],
h[pts]}, fullopts, Lighting -> {{"Ambient", White}}] /
Rasterize;
dashedlayer = Show[basegraphClean /.
{Polygon[__] :> {}, Line[pts__] :> {Dashed, Line[pts]}} /.
h_[pts___] /; MemberQ[face3DPrimitives, h] :> {FaceForm[],
EdgeForm[{Dashed}], h[pts]}, fullopts] / Rasterize;
borderlayer =
Show[basegraphClean /. RGBColor[__] :> Black,
ViewAngle -> (1 - .001) OptionValue[ViewAngle],
Lighting -> {{"Ambient", Black}}, fullopts, Axes -> False,
Boxed -> False] / Rasterize / GradientFilter[#, 1] & /
ImageAdjust;
ImageSubtract[frontlayer, dashedlayer] / effectFunction /
ImageAdd[frontlayer / ColorNegate, #] & /
ImageAdd[#, borderlayer] & / ColorNegate / ImageCrop]
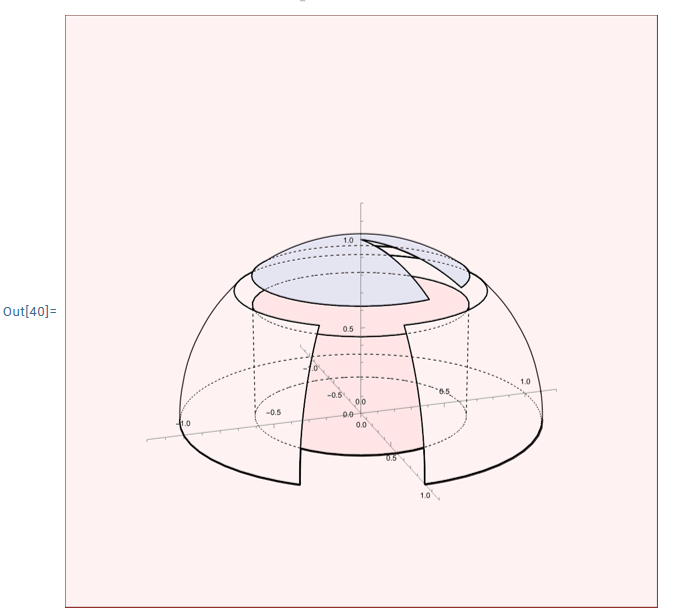
graph1 =
Show[{SphericalPlot3D[
1, {\[Theta], 1/5 1.2 \[Pi], \[Pi]/2}, {\[Phi], 0, 1.8 \[Pi]},
PlotStyle -> White, PlotPoints -> 50, Mesh -> None,
BoundaryStyle -> Black],
SphericalPlot3D[
1, {\[Theta], 0, \[Pi]/5}, {\[Phi], \[Pi]/4, 2.1 \[Pi]},
PlotStyle -> FaceForm[Lighter[Blue, .9], GrayLevel[.9]],
PlotPoints -> 50, Mesh -> None, BoundaryStyle -> Black],
Graphics3D[{FaceForm[Lighter[Pink, .8], GrayLevel[.8]],
Cylinder[{{0, 0, 0}, {0, 0, .8 Cos[\[Pi]/5]}}, Sin[\[Pi]/5]]}]},
PlotRange -> 1.2 {{-1, 1}, {-1, 1}, {0, 1}},
AxesOrigin -> {0, 0, 0}, Boxed -> False, SphericalRegion -> True];
DashedGraphics3D[graph1]
The excellent answerer mentioned a sentence in their response: "The hidden border of the cylinder's side-wall can not be extracted by the "shadow" method (described below) used in DashedGraphics3D[ ], so ParametricPlot3D[ ]-akin functions are needed instead of simply Cylinder[ ].". However, after I replaced the relevant code snippet with a parametric plot, the visual result was unsatisfactory. Therefore, I’d like to ask: what exactly did that sentence mean , and how should I proceed to properly render the cylinder's generatrices?
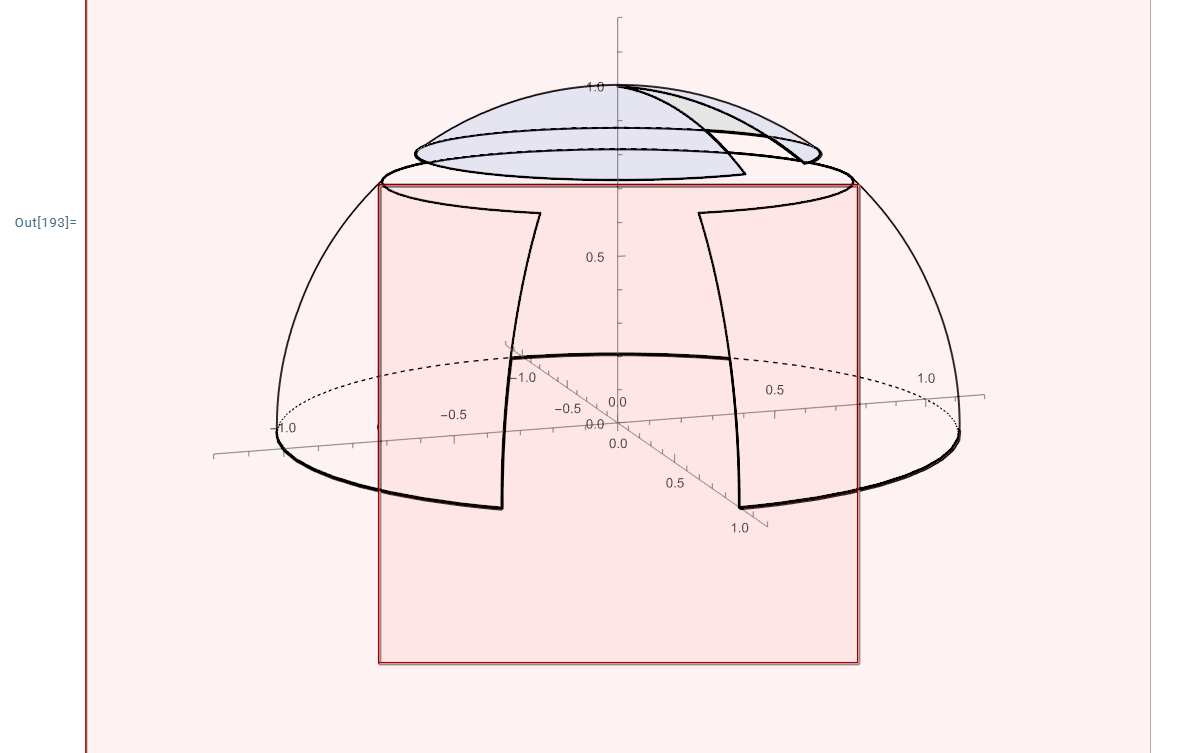
Here is my code after replacing Cylinder[] with ParametricPlot3D[], and the resulting plot is shown in the figure below. As can be seen, the rendered graphic is not satisfactory.
  graph2 =
      Show[{SphericalPlot3D[
         1, {\[Theta], 1/5 1.2 \[Pi], \[Pi]/2}, {\[Phi], 0, 1.8 \[Pi]},
         PlotStyle -> White, PlotPoints -> 50, Mesh -> None,
         BoundaryStyle -> Black],
        SphericalPlot3D[
         1, {\[Theta], 0, \[Pi]/5}, {\[Phi], \[Pi]/4, 2.1 \[Pi]},
         PlotStyle -> FaceForm[Lighter[Blue, .9], GrayLevel[.9]],
         PlotPoints -> 50, Mesh -> None, BoundaryStyle -> Black],
        Graphics3D[{FaceForm[Lighter[Pink, .8], GrayLevel[.8]],
          ParametricPlot3D[{Cos[\[Theta]], Sin[\[Theta]], z}, {\[Theta],
            0, 2 \[Pi]}, {z, 0, 2}]}]},
       PlotRange -> 1.2 {{-1, 1}, {-1, 1}, {0, 1}},
       AxesOrigin -> {0, 0, 0}, Boxed -> False, SphericalRegion -> True];

    DashedGraphics3D[graph2]
Today,I fed my question into an AI and asked it for a solution. The AI provided a piece of code that is supposed to process the silhouette of the cylinder. However, when I ran it in Mathematica 14.3, the output graphic appeared pink—likely indicating that something is wrong with the code. Yet, no error messages were displayed. I’m not sure where the issue lies in this code that causes the output to be rendered in pink.
ClearAll[DashedGraphics3D, cylinderSilhouetteLines]

DashedGraphics3D::optx =
  "Invalid options for Graphics3D are omitted: `1`.";
Off[OptionValue::nodef];

Options[DashedGraphics3D] = {ViewAngle -> 0.4,
   ViewPoint -> {3, -1, 0.5}, ViewVertical -> {0, 0, 1},
   ImageSize -> 800, EffectFunction -> Identity };

cylinderSilhouetteLines[Cylinder[{p1_, p2_}, r_],
  viewPoint_?VectorQ] :=
 Module[{axis, v, vPerp, dir, t1, t2}, axis = p2 - p1;
  If[Norm[axis] < 10^-6, Return[{}]];
  axis = Normalize[axis];
  v = Normalize[viewPoint - (p1 + p2)/2];
  vPerp = v - (v . axis) axis;
  If[Norm[vPerp] < 10^-6, {}, dir = Normalize[Cross[axis, vPerp]];
   t1 = {p1 + r dir, p2 + r dir};
   t2 = {p1 - r dir, p2 - r dir};
   {Line[t1], Line[t2]}]]

DashedGraphics3D[basegraph_, opts : OptionsPattern[]] :=
 Module[{basegraphClean, exceptopts, fullopts, frontlayer,
   dashedlayer, borderlayer, viewPoint,
   effectFunction = OptionValue[EffectFunction],
   face3DPrimitives = {Cuboid, Cone, Cylinder, Sphere, Tube,
     BSplineSurface}},
  viewPoint = OptionValue[ViewPoint];
  If[! VectorQ[viewPoint, NumericQ], viewPoint = {3, -1, 0.5}];

  basegraphClean = basegraph /. Lighting -> Sequence[];
  basegraphClean =
   basegraphClean /.
    cyl : (Cylinder[{{_?NumericQ, _?NumericQ, _?NumericQ}, {_?
           NumericQ, _?NumericQ, _?NumericQ}}, _?NumericQ]) :> {cyl,
      cylinderSilhouetteLines[cyl, viewPoint]};

  exceptopts = FilterRules[{opts}, Except[Options[Graphics3D]]];
  If[exceptopts =!= {}, Message[DashedGraphics3D::optx, exceptopts]];
  fullopts =
   Join[FilterRules[Options[DashedGraphics3D], Except[#]], #] &@
    FilterRules[{opts}, Options[Graphics3D]];

  frontlayer =
   Show[basegraphClean /. Line[pts__] :> {Thick, Line[pts]} /.
      h_[pts___] /; MemberQ[face3DPrimitives, h] :> {EdgeForm[{Thick}],
         h[pts]}, fullopts, Lighting -> {{"Ambient", White}}] /
    Rasterize;
  dashedlayer =
   Show[basegraphClean /. {Polygon[__] :> {},
        Line[pts__] :> {Dashed, Line[pts]}} /.
      h_[pts___] /; MemberQ[face3DPrimitives, h] :> {FaceForm[],
        EdgeForm[{Dashed}], h[pts]}, fullopts] / Rasterize;
  borderlayer =
   Show[basegraphClean /. RGBColor[__] :> Black,
       ViewAngle -> (1 - .001) OptionValue[ViewAngle],
       Lighting -> {{"Ambient", Black}}, fullopts, Axes -> False,
       Boxed -> False] / Rasterize / GradientFilter[#, 1] & /
    ImageAdjust;

  ImageSubtract[frontlayer, dashedlayer] / effectFunction /
      ImageAdd[frontlayer / ColorNegate, #] & /
     ImageAdd[#, borderlayer] & / ColorNegate / ImageCrop]
graph1 =
  Show[{SphericalPlot3D[
     1, {\[Theta], 1/5 1.2 \[Pi], \[Pi]/2}, {\[Phi], 0, 1.8 \[Pi]},
     PlotStyle -> White, PlotPoints -> 50, Mesh -> None,
     BoundaryStyle -> Black],
    SphericalPlot3D[
     1, {\[Theta], 0, \[Pi]/5}, {\[Phi], \[Pi]/4, 2.1 \[Pi]},
     PlotStyle -> FaceForm[Lighter[Blue, .9], GrayLevel[.9]],
     PlotPoints -> 50, Mesh -> None, BoundaryStyle -> Black],
    Graphics3D[{FaceForm[Lighter[Pink, .8], GrayLevel[.8]],
      Cylinder[{{0, 0, 0}, {0, 0, .8 Cos[\[Pi]/5]}}, Sin[\[Pi]/5]]}]},
    PlotRange -> 1.2 {{-1, 1}, {-1, 1}, {0, 1}},
   AxesOrigin -> {0, 0, 0}, Boxed -> False, SphericalRegion -> True];

DashedGraphics3D[graph1, ViewPoint -> {3, -1, 1}]
graph2does not work sinceGraphics3D[{FaceForm[Lighter[Pink, .8], GrayLevel[.8]], ParametricPlot3D[{Cos[θ], Sin[θ], z}, {θ, 0, 2 π}, {z, 0, 2}]}]get the error message. $\endgroup$